Plotting Earthquakes
I wanted to see how to plot the earthquakes on the global map. Here we will be using the historical earthquake data from USGS and plot it on the world map.
A simpler and approximate method to render a world map view is to render the major cities for the world.
We will be using Pandas, Jupyter Notebook and matplotlib to render these plots.
Download the city locations
First, we will see how the plot looks with the city locations. I used this repo to get locations of all major cities:
curl https://raw.githubusercontent.com/bahar/WorldCityLocations/master/World_Cities_Location_table.csv > cities.csv
Plot the cities
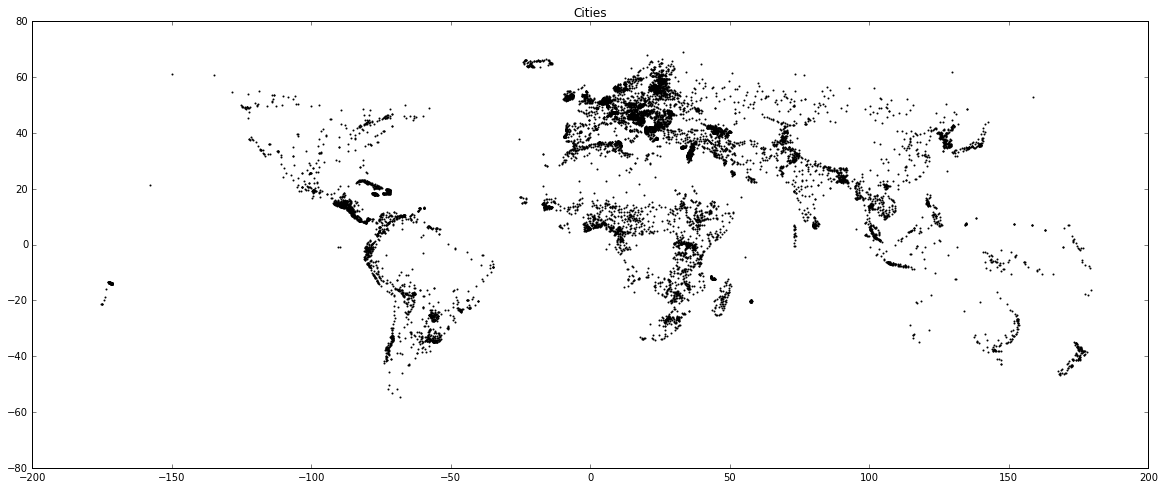
We read the latitude and longitude and create a scatter plot with the city locations.
df_cities = pd.read_csv("cities.csv", sep=";", header=None, names=["id","country","city","lat","lon","alt"])


y = df_cities.lat
x = df_cities.lon
plt.scatter(x,y,1)
plt.title("Cities")
plt.plot()
Beautiful! And it looks like a world map. Well, almost :)
Download the earthquake data
The data is downloaded from USGS. We can perform advanced search on the USGS Earthquake database here:
For this demo, I am going to use data from 18-Feb-1917 to 16-Aug-2018. We can download only 20,000 rows per call and we will have to iterate with multiple calls for all the data. However, to keep this simple, we will add a filter with a minimum earthquake magnitude of 5.8.
This search query downloads the data to a CSV file:
curl "https://earthquake.usgs.gov/fdsnws/event/1/query.csv?starttime=1817-02-18%2000:00:00&endtime=2018-08-16%2023:59:59&minmagnitude=5.8&orderby=time&limit=20000" > earthquake_data.csv

wc -l earthquake_data.csv // we have 16473 rows
Plot the earthquake data:
df = pd.read_csv("earthquake_data.csv")

y = df.latitude
x = df.longitude
s = df.mag
plt.scatter(x,y,s)
plt.title("EarthQuakes")
plt.plot()
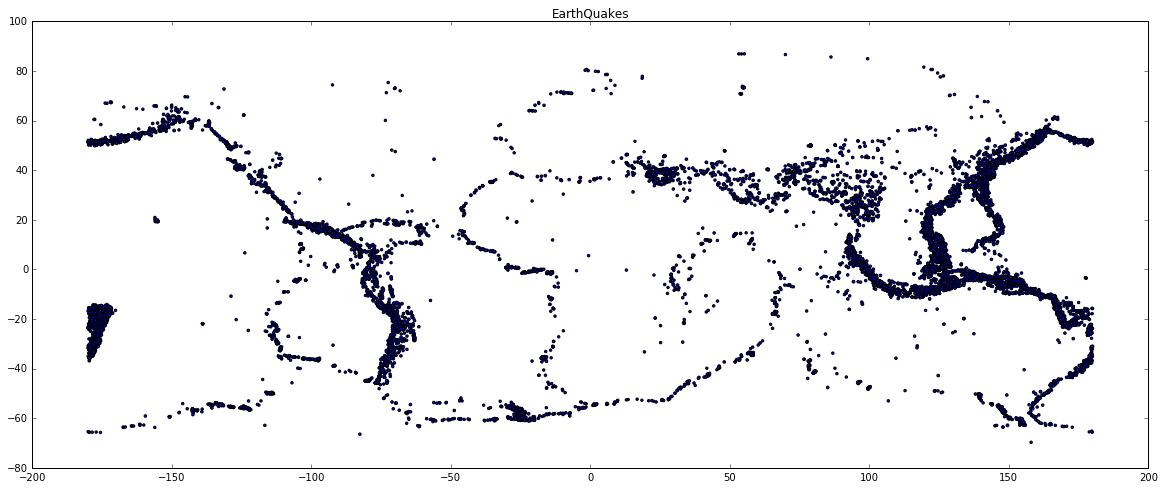
Remember, we have filtered the earthquake data with a minimum magnitude
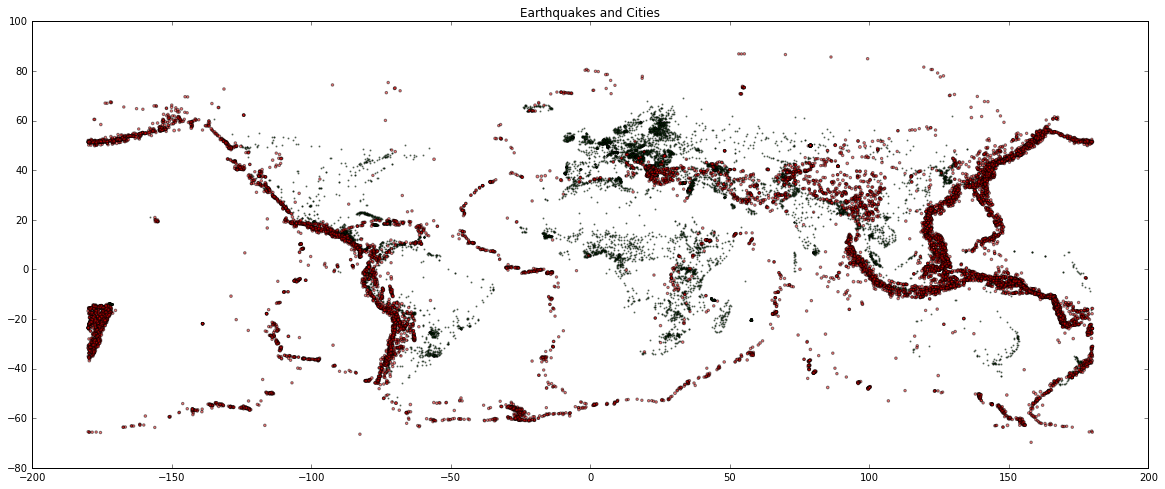
Plot the city and earthquake locations together
y = df_cities.lat
x = df_cities.lon
plt.scatter(x,y,1, c='g', alpha=0.5)

y = df.latitude
x = df.longitude
s = df.mag
plt.scatter(x,y,s, c='r', alpha=0.5)

plt.title("Earthquakes and Cities")
plt.plot()
Complete code from the Jupyter notebook:
%matplotlib inline
import pandas as pd

import matplotlib
import matplotlib.pyplot as plt
plt.rcParams["figure.figsize"] = (20,8)

# Plot cities
df_cities = pd.read_csv("cities.csv", sep=";", header=None, names=["id","country","city","lat","lon","alt"])

y = df_cities.lat
x = df_cities.lon
plt.scatter(x,y,1)
plt.title("Cities")
plt.plot()

# Plot earthquakes only
df = pd.read_csv("earthquake_data.csv")

y = df.latitude
x = df.longitude
s = df.mag
plt.scatter(x,y,s)
plt.title("EarthQuakes")
plt.plot()

# Plot combined
y = df_cities.lat
x = df_cities.lon
plt.scatter(x,y,1, c='g', alpha=0.5)

y = df.latitude
x = df.longitude
s = df.mag
plt.scatter(x,y,s, c='r', alpha=0.5)

plt.title("Earthquakes and Cities")
plt.plot()