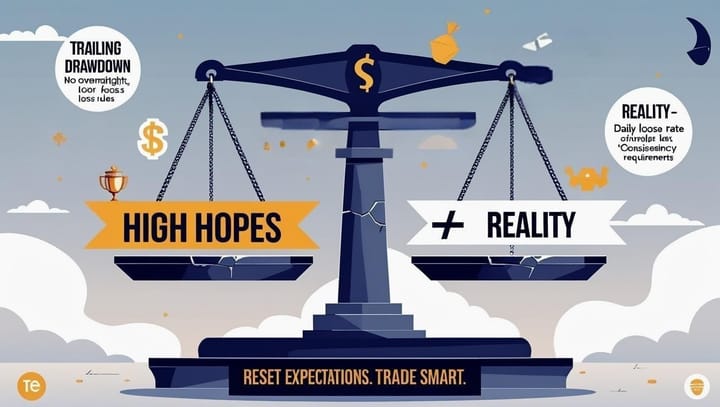
Why Your Trading Strategy Fails You: It’s Not Just the Metrics
Evaluating a strategy isn’t just stats—it’s about mindset, drawdown tolerance, and lifestyle fit. Here’s my stick-with-it framework.
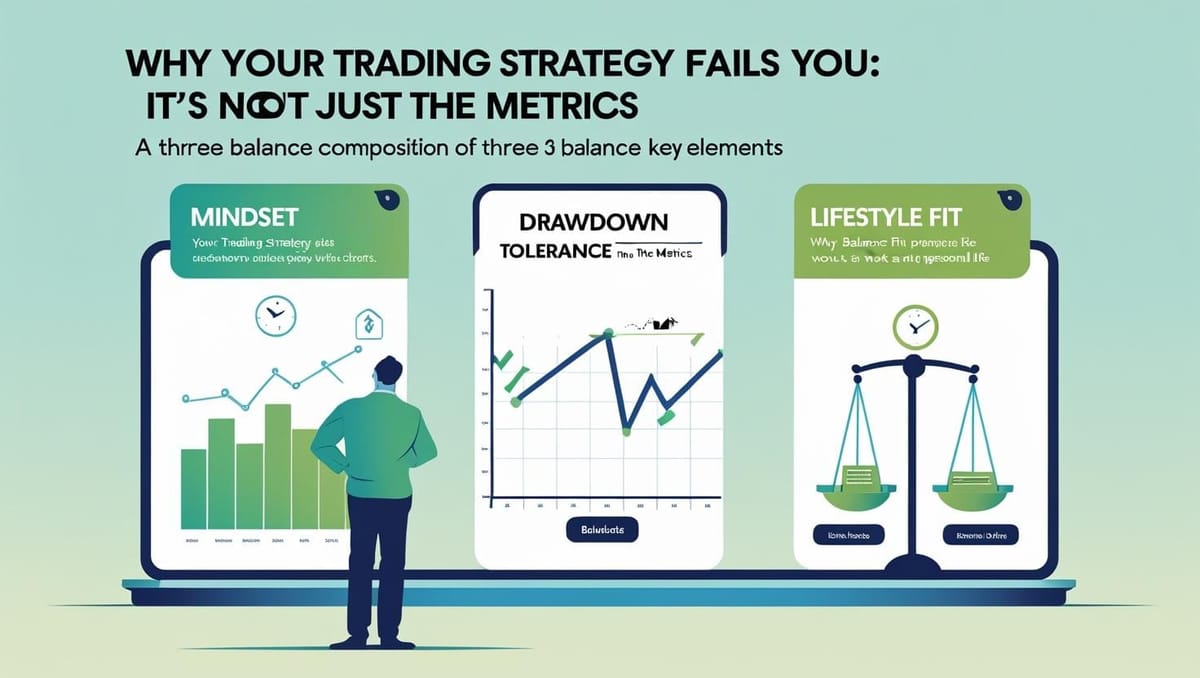
As an individual retail trader, evaluating a trading strategy isn’t just about stats. It’s about the psychological fit, the drawdowns you can handle, and how your lifestyle aligns with the trading routine. Here’s a framework for evaluating a strategy you can stick to.
Find a strategy personality fit
Most posts about evaluating trading strategies delve into metrics such as Sharpe ratios, Sortino ratios, or profit factors. While those are important, this post isn’t about them.
This is about finding a strategy-personality fit.
You can have a profitable strategy on paper with acceptable ratios. Still, if it doesn’t align with your mindset, schedule, or psychology, you will abandon it during drawdowns or, worse, break its rules and sabotage it. As an individual, not a fund, you will experience emotions that can shake your consistency and execution.
NOTE: Here, I am comparing the aspects related to manual trading (discretionary or systematic). If you are comparing it to algorithmic trading, some of these aspects may be non-issues unless you keep anxiously watching your algo dashboards.
📌 Note: This post complements another one I wrote titled "The Accuracy Trap", which explores how high win-rate strategies can still fail if they lack proper reward-to-risk ratios. While that post warns against over-focusing on accuracy, this one emphasizes finding the sweet spot between statistical viability and personal comfort—what I call strategy-personality fit.
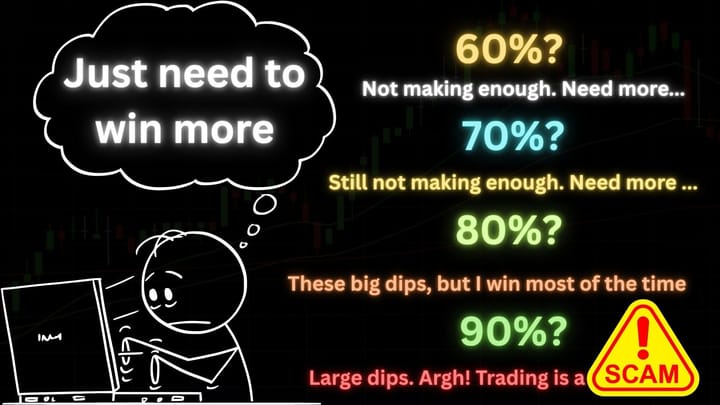
1. Win Rate vs. Frequency: What Do You Need?
When evaluating win rate, context is everything.
A 30% win rate with a 3:1 or higher reward-to-risk might be fine if you take five trades or more every day. But if you take just one trade a day, 30% can "feel like" you're wrong most of the time - even though you are not. It's just that the length of time between wins can wear you down. It still requires psychological readiness to sit through frequent losses while waiting for those occasional big wins.
I prefer strategies that offer (minimum) 35–40% win rates, especially when I take 2–3 trades within a predictable timeframe, like the first two hours of the market.
“Low win rate, high reward” strategies may look statistically significant on paper, but can break your will in real life, especially if you miss one big win or can’t handle long streaks of losses.
2. Strategy Lifestyle Compatibility
Before going deeper into metrics and numbers, I ask:
- Can I even live with this strategy? Does the profit curve look acceptable?
- Will the signals show up at 2 AM? Am I willing to wake up to an alert?
- Do I need to monitor charts for 6 hours a day or 12 hours a day?
- Do I even like discretionary setups when I have to make decisions?
- Do I even like fully systematic setups when I can have no discretion?
If you can't follow the lifestyle the strategy demands, it's a mismatch- no matter how profitable it appears on paper.
Automation helps, but even then, I must ask:
- Will I interfere after three losing trades?
- Will I second-guess the system if I see early drawdowns?
If so, I either need to adjust the strategy or adjust my expectations.
Examples
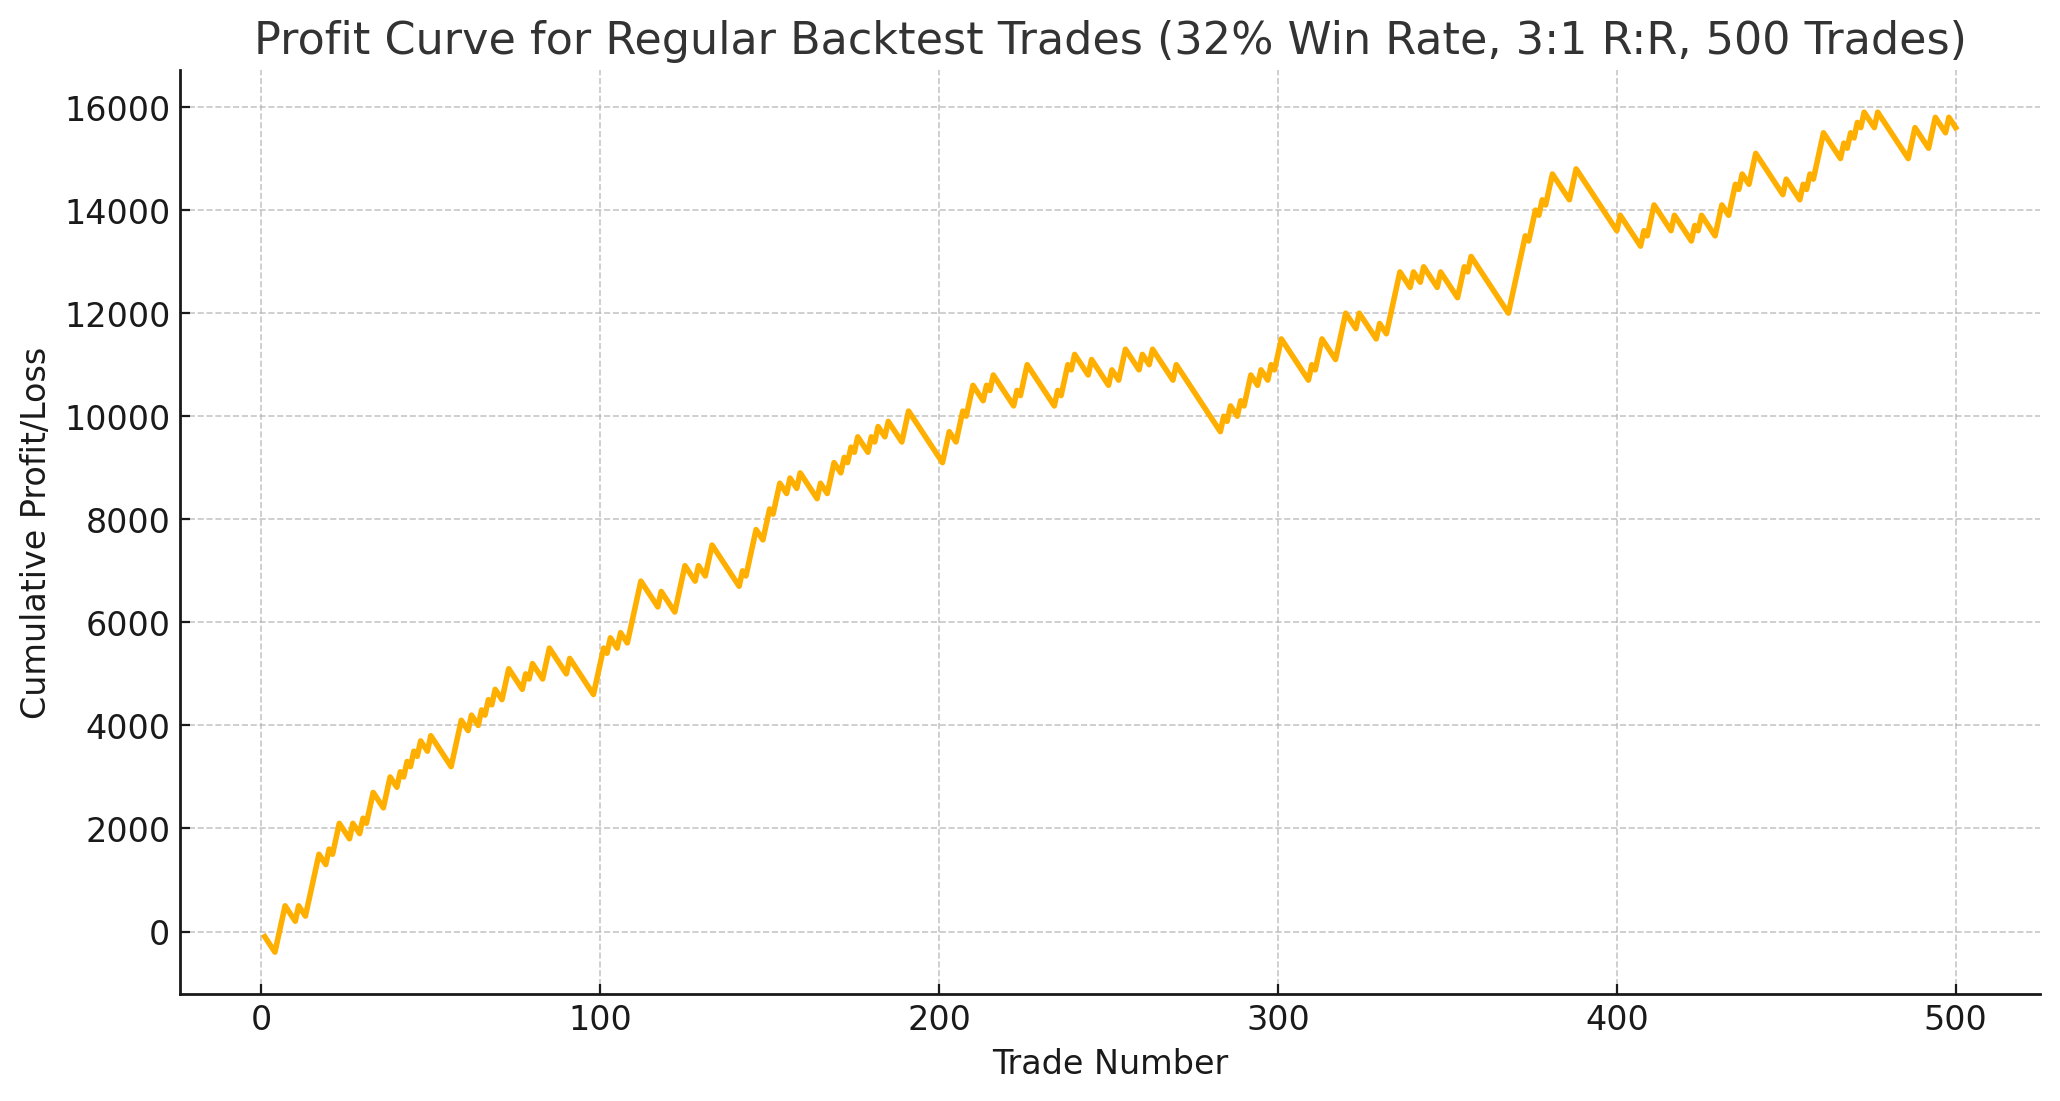
Let us look at some profit curves for example over a year of backtest
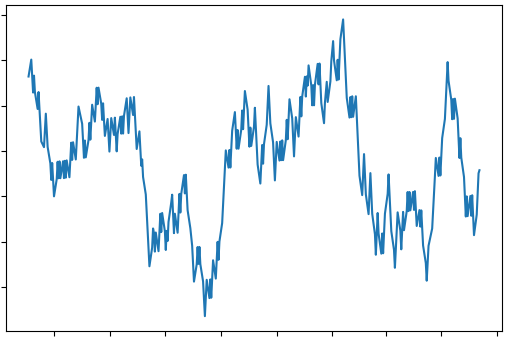
The first one above will not generate consistent returns, but it does experience periods of profit-making, only to lose it all. It stays around breakeven. Rare use — if any at all.
The second one (below) is profitable, but it spends a few months in drawdown. The question is — am I okay with losing for a few months? It also has larger dips.
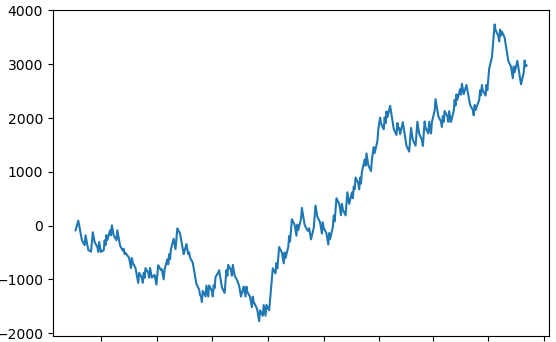
It is usable, but I would look for something better. I am not comfortable with making no progress for multiple months; I would be more inclined to abandon the strategy.
The third one (below) is stable. This has a larger drawdown, too, but these drawdowns tend to be quicker compared to the previous one. There are a couple of months where it stays sideways to a small drawdown. Something that I will be more willing to deploy unless I find something better.
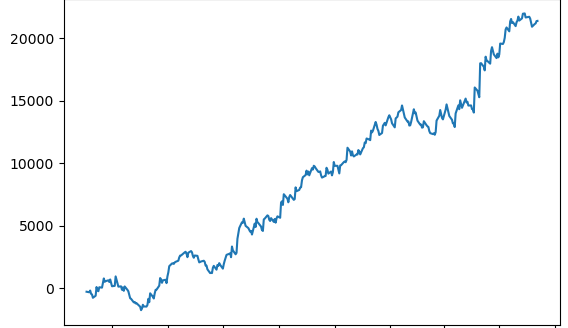
Examining the profit curves will enable you to determine what is a good fit for you. Try to place yourself at a random point on the profit curve and see how comfortable you would be taking trades with those results. Catching the mid-term top of a profit curve when you start, and then seeing a drawdown , will raise a lot of second thoughts. It is only through your preparation/homework that you will be well-prepared during those phases.
The last profit curve looks smooth and has a good Sharpe ratio. It looks and is fantastic. But I have seen failure with it because of
- Lack of consistent execution, oversizing.
- Being under time pressure to prove
- Frustration with no progress during its sideways movements
- Non-trading work-related frustrations fueling the sentiment
- FOMO often leads to closing positions at a smaller profit.
- It messes with my sleep — almost always.
Psychological pressures can play a significant role in determining how your strategy performs in the real world. To make it work for me, I had to adjust my schedule, apply a few automations and checklists, and gradually make it as independent of me as possible.
3. Profit Curves and Psychological Drawdowns
A rising profit curve means little if it hides a gut-wrenching drawdown in the middle.
If the max drawdown of a strategy is something you can't stomach, the strategy is incompatible.
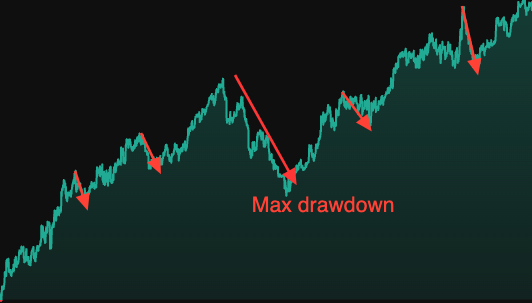
I recall seeing a profit curve shared by a trading guru — everything initially appeared to be an upward slope. But hidden within was a massive dip: a single drawdown that was as large as months of gains. It was visually deceptive and psychologically brutal. That one curve told me everything I needed to know about whether I could use such a strategy.
The ratios and numbers might check out, but if I can’t handle the visual and emotional hit of that drop, it’s not a fit for me.
Drawdown isn’t just a number; it’s a test of your psychological endurance and risk parameters.
Ask yourself: What if I had started trading right near the peak before that drawdown? If you cannot stomach and survive the drawdown, that strategy isn’t the right fit — or may be something you only use with a smaller position size.
Another critical question to ask: "How often does this largest drawdown occur?" If it is not often, the strategy and profit curve may still look usable.
Even if the historical max drawdown was 13 trades, remember: future performance can go worse. Always pad for a buffer.
Your psychology must align with the worst aspects of the strategy, not just the best.
4. Monte Carlo Simulations: Stress Testing the Profit Curve
Backtesting gives a straight-line story, but life doesn’t work that way.
I take my backtest trades and randomize their order multiple times, like the Monte Carlo simulations, to estimate a secondary worst-case drawdown.
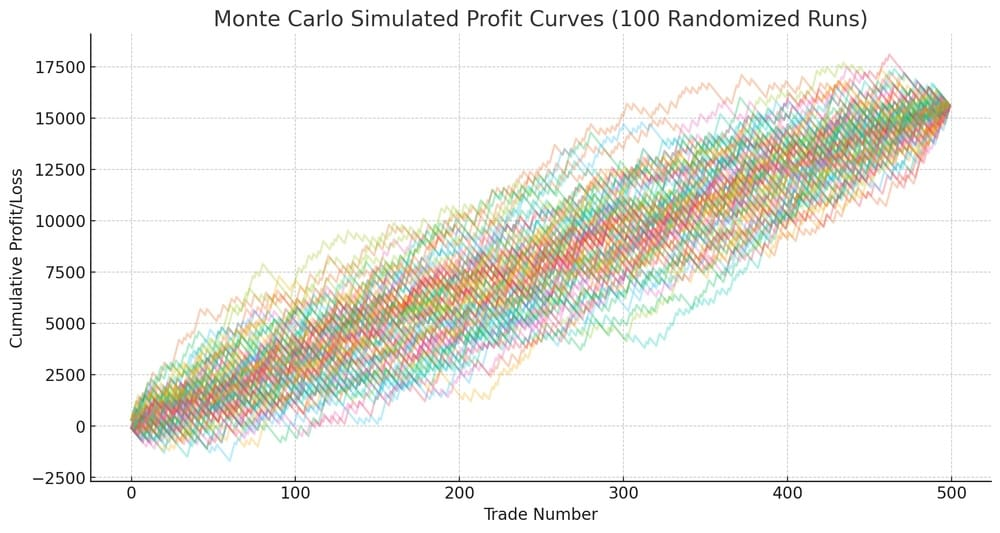
And these are the max-drawdowns from those simulations
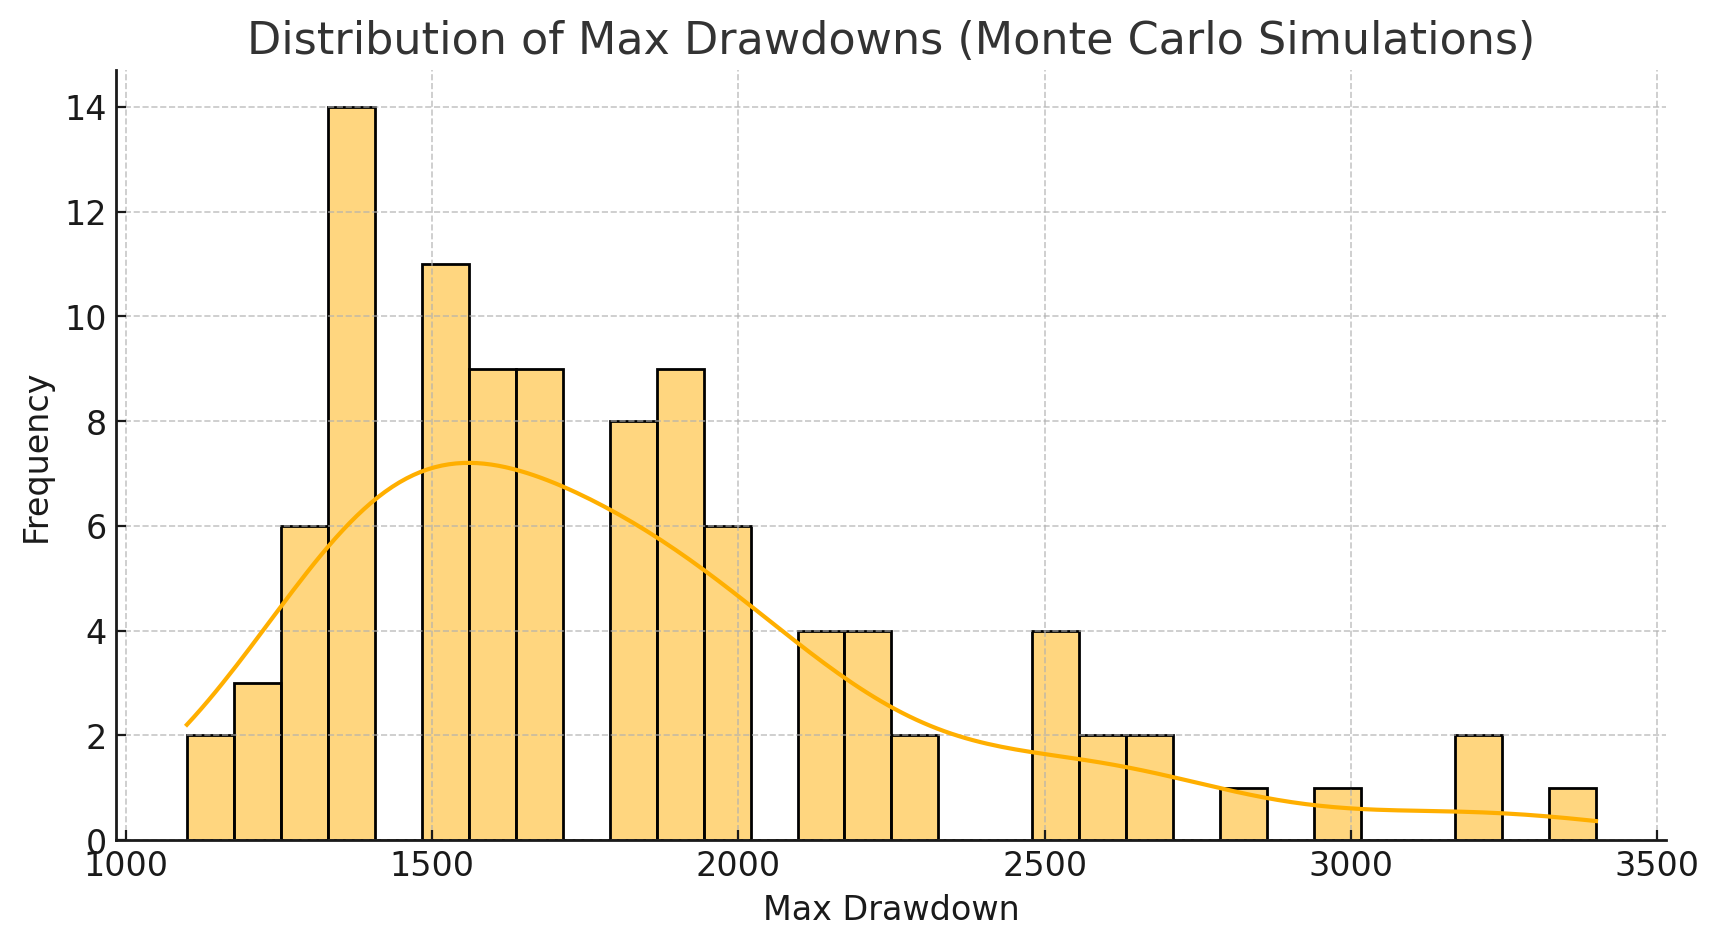
This reveals:
- The average drawdown
- The worst-case drawdown across permutations
Once I get this, I add a buffer (~30%) and calculate the risk capital needed. And remember that it is the risk capital, which could completely go to zero when drawdowns exceed the estimated parameters.
If my worst-case drawdown is $2,000, I might allocate $2,600, plus the risk of one additional trade (~$200), totaling $2,800 per unit position size. Or maybe round it to $3,000 per unit position size.
5. Capital Allocation & Sizing
Let's assume that this was with 1 MNQ. So, now that I have $3,000 that I can afford to lose - aka risk capital, then I can trade this strategy with 1 MNQ. If it were $6,000, I could increase the position size to 2 MNQ and so on until I hit a risk feasibility and appetite limit.
This provides me with a positioning ladder based on drawdown awareness, rather than gut feel.
NOTE: This is not your standard 1-2% risk per trade calculation. And this is not the margin capital. The deployed risk capital is the maximum amount you are willing to lose over multiple trades that may span days, months, or years, until the strategy fails. The margin requirements may be higher or lower than the risk capital — depends on your other factors.
6. Max Consecutive Losses & Wins
You'll need to know what your strategy is capable of.
Knowing what the max consecutive loss is will give you the confidence to take the trade even when a losing streak starts. Most people cannot stomach 10 consecutive losses. But when you know that the maximum number of consecutive losses your strategy tends to give is 10, you will be able to take the 11th trade with confidence. Knowing this statistical value allows you to pre-determine whether this is the strategy you are willing to use.
Gambler's fallacy: If your max-consecutive loss value is 11, and the strategy has a 40% win rate, it does not guarantee that the twelfth trade is going to be a profit. The probability for each trade is independent. Assuming it’s going to win, without a good statistical strategy, is a form of the gambler’s fallacy.
When things are going better than expected, it’s easy to ignore the statistics. Observing the max consecutive wins can alert you to regime changes. If you suddenly see five wins where the maximum was four, something has changed.
It’s convenient to focus only on the max consecutive losses and treat wins as mere bonuses, but ignoring unusually long win streaks means ignoring that your strategy has broken out of its known shell. It does not warrant immediate action; it should definitely raise a warning flag. Something has shifted, and it deserves closer observation.
7. Daily/Weekly/Monthly Profitability Days
I track how many profitable days per week or month the strategy yields.
This isn’t a strong signal, but it helps psychologically. Even in a losing month, I need some winning days to stay engaged. However, that may not be the case for you.
Same with negative months per year. If I know I might lose 2 months out of 12, I am prepared to deal with it. Similarly, after a couple of large winning months, the expectation of a losing month increases. But these do not warrant changing position sizes without statistical validation.
8. Automation & Psychological Buffering
Finally, let’s talk about the emotional challenges of automation. These will show up when you are using a new strategy or an old one has broken out of its known shell.
With automated trading, things improve slightly. You have offloaded your psychological workload—unless you watch the automation like a hawk.
Automation without emotional detachment is just a manual trader with a dashboard.
For automated systems or systematic manual trading, the key is parameter monitoring. The questions to ask are like this:
- Is the strategy within the expected drawdown?
- Has it breached the maximum number of consecutive losses and any buffer?
- Has it breached its maximum drawdown?
Once the strategy breach is revealed, whether positively or negatively, it warrants action. The action may be either or all of these:
- Allow it to run for a little longer.
- Reduce the position size.
- Pause the strategy or paper trade it.
- Discard it for the time being.
Market regime changes can cause this. If the strategy has not breached the barriers, please trust the system.
Metrics we discussed
Before you get into the mindset, you must have these metrics for your reference. You want to look at:
Max consecutive losses. Can I psychologically handle these many losses? Don’t just say “I’ll stay disciplined.” Test it out first with paper trading or small position sizes to get a feel for it.
Max drawdown. Am I ready to lose this much twice or thrice? If not, reduce your position size or explore better options.
Max consecutive wins. Well, who wants to limit winners? You should not. Keep track, though. Mean reversion is real.
Win rate. Higher is not always better. You are looking for a number that you can psychologically afford to endure without too much willpower.
Average Win, Average Loss, and the Average Win to Loss Ratio. Let the strategy backtest define this for you. Keep pushing for unlimited wins and limited losses. You will find a working ratio for your signals.
Average Daily return, Average monthly return. Help plan to pay yourself!!
And a few metrics, such as the maximum and average consecutive loss-making days, help you stay mentally prepared. Also, keep a note of how many consecutive weeks or months it continues to make losses. This enables you to set your expectations right, but depending on the sample size, those may not be used as boundaries for your strategy.
Final Thoughts
You may reject many strategies with this framework. But ask yourself — is it better to reject a strategy? Or is it better to reject your money?
This post is not about finding the most profitable system.
It’s about finding a strategy you can live with.
Backtest data tells you what might happen.
Psychology decides whether you stick through it.
Don’t optimize for just the peak equity. Optimize for the emotional valley, and optimize to survive and grow steadily.

Comments ()